Athletes Unlimited Volleyball Scoring: The Simulations
The initial development of any scoring system tends to be theoretical in nature. Determining the value of a skill involves some discussion of its relative importance to other skills, how difficult it is to execute well, and the outcome of a match. This is the stage of development where volleyball experts and game theorists excel: the collective experience over years of studying matches and observing human behavior and logic lays the foundation to make certain conclusions about how likely certain scenarios will play out and how valuable they are to the teams within them.
However, a scoring system does not succeed on intuition and theory alone. To confirm the expectations laid out by these experts, data analysts need to process historical data of actual matches featuring actual athletes to see if the numbers match the hypotheses. In order to do that, they need to translate common sense assumptions from the real world — for example, that a certain pool of players will exist within some intangible range of talent — into statistical frameworks upon which data simulations can be conducted. How do you even begin?
SETTING A BASELINE
One of the biggest challenges is figuring out which data set(s) to use. Thankfully, Volleymetrics is a rich resource full of historical data across years of high-quality volleyball matches. We were able to secure an initial data set of 15,000 records across six years of matches featuring the world’s Top 20 international teams and several other professional leagues. Each record represents one player and is segmented by skill, which is a great place to start when it comes to the individual point system.
Once we had nailed down what point values to assign to individual skills, the next step was to determine the average performance of each skill based on analysis of these records. How many kills on average would an Athletes Unlimited-calibre outside hitter get in a match? How many passes? This also helped us gain insight on skill usage per position, which means we can better understand where positions will earn their individual points.
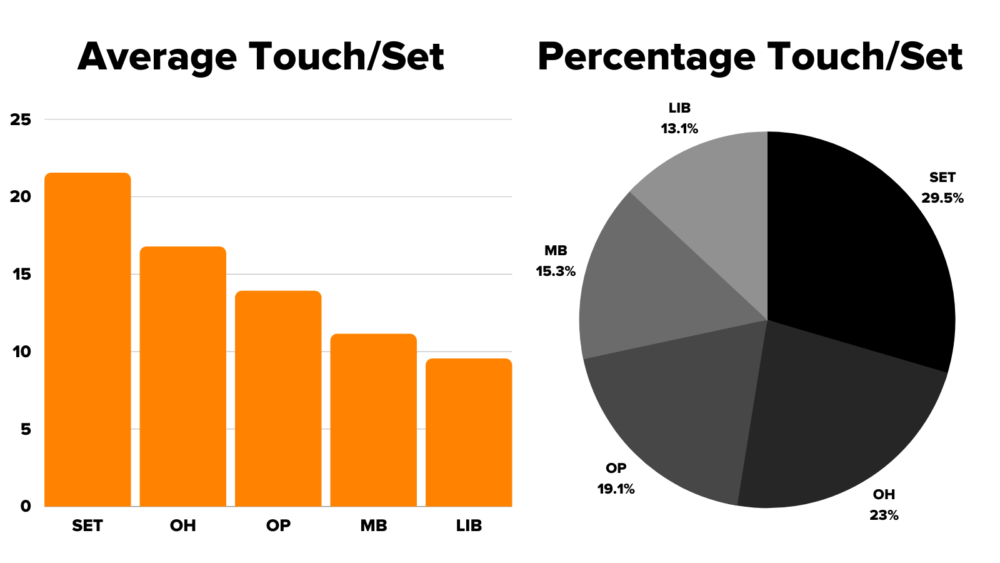
Analysis of our initial data set can help us determine key statistical trends, like how often a position will touch the ball during a set. If we compare this against the kinds of skills each position is most likely to perform, we can make decisions on how to weigh certain skills and penalties to give all positions a fair shot at scoring points.
Using this initial data set, we could apply the scoring system we developed to generate means and standard deviations for each measurable skill for each position. Put another way, we can determine the average performance of a skill across positions, as well as the likely range of performance for someone below or above that average.
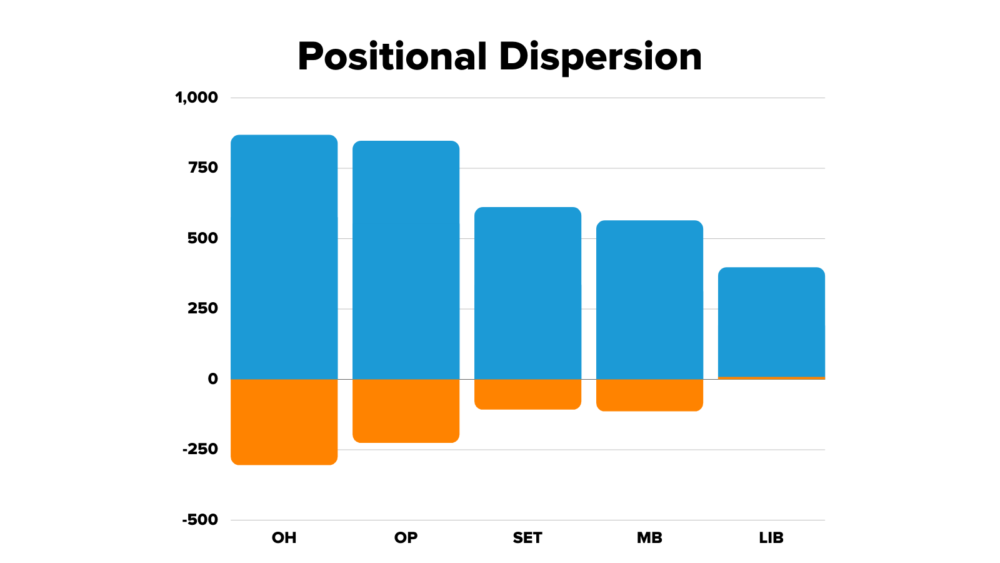
After applying the point system to historical data, we can identify what the average individual score is for each position per match, as well as the possible range. Outside hitters and opposites have the widest variability, with the opportunity to win big but also lose big. Meanwhile, setters, middle blockers, and liberos have less variability in how well they can perform during a match.
VALIDATING THE INDIVIDUAL POINT SYSTEM
Now that we have means and standard deviations calculated based on actual historical performance, we can construct simulations of entire Athletes Unlimited seasons to see how theoretical players would do. The first simulation we wanted to run was a basic reality check of our point system: if all players in a certain position were equally skilled with similar point ranges for each position, what would be the outcome?
Each iteration of the simulation contains 15 matches, or the number of matches an athlete will play in the season. In order to replicate the concept that all players are equally matched, each player was assigned a score between ±1 standard deviation from the mean for each skill based on position. Then, to make sure that the results of the simulation were statistically significant, this iteration of 15 matches was run 300 times to increase the sample size. This also helped us evaluate the data for any potential volatility and identify any edge cases or vulnerabilities to avoid during the design of the system.
Once the player points were accumulated for each of the 300 league simulations, we then began charting out maximum, minimum, mean, and median point values for specific players as well as positions. The goal was to lay out the most common outcome that could be expected, while also evaluating any exception cases that may arise. The result?
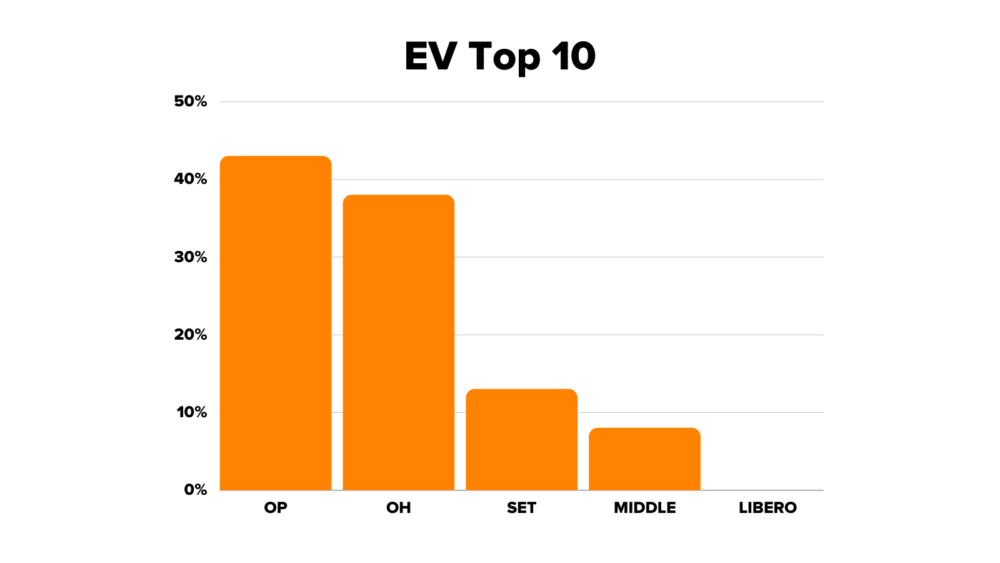
This chart represents the likelihood that a particular position will end up in the top 10 spots on the leaderboard by the end of the season. You’ll notice that liberos are extremely unlikely to compete on a level playing field with the other positions, particularly opposites and outside hitters. Besides, this initial simulation isn’t the most realistic outcome for the league: it’s extremely unlikely that all of the players will be perfectly matched against each other. How can we make this simulation more realistic and provide more balanced scoring opportunities?
MAKING TALENT TANGIBLE
While no statistical measurement can perfectly measure human variability in performance, you can make some approximations that model ranges of talent. If a setter tends to make poor passes more often than good ones, you could estimate that they are competing at the 40th percentile of the range for that skill, rather than at the mean. Meanwhile, a libero who makes consistently good digs could be competing at the 60th percentile of the range for that skill. We can divide the player pool into thirds to evaluate skill performance on different tiers of low, medium, and high to better reflect differences in performance.
Another thing to consider is that teams have more players in a certain position than others, which means that their usage over the course of a match can vary. For example, there are three middle blockers per team. The best middle blocker on that team could expect to be on the court 80% of the time, while the worst middle blocker may only be on the court 20% of the time. This further compounds the frequency of scoring opportunities players can have if they compete at a corresponding percentile of performance.
Once these percentages and values are assigned to the theoretical players of our simulation, we can run the 300 iterations like we did in the previous simulation. With these more realistic factors now folded in, how does our top 10 leaderboard look?
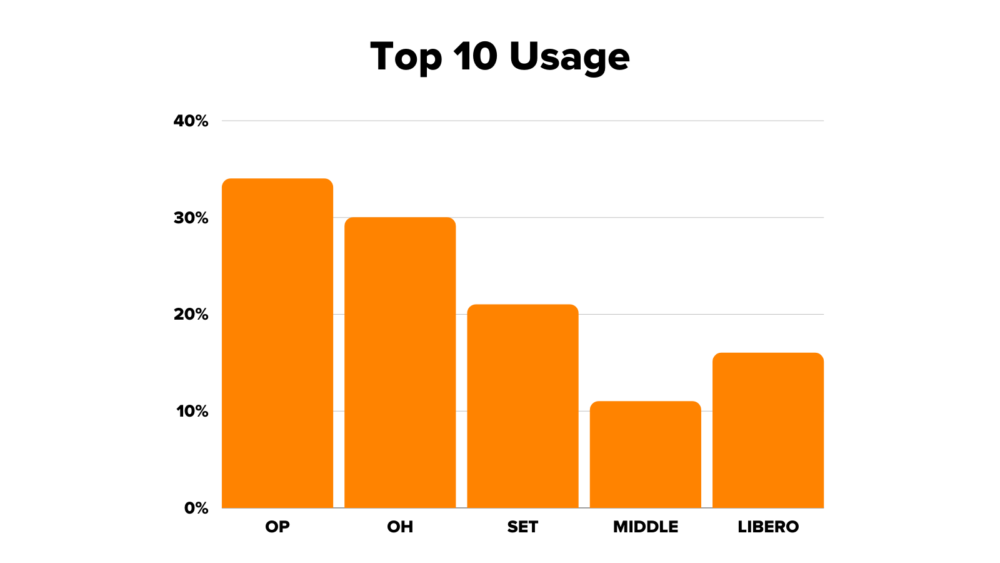
The playing field looks much more level now, particularly for setters and liberos. Since there’s only one libero per team, they’ll have 100% of the playing opportunities in each match, which greatly supplements the limited opportunities they have to score individual points. Meanwhile, opposites and outside hitters are less likely to do well just because they’re opposites and outside hitters: their performance is more likely to impact whether they’re on the court or on the bench.
To further validate the results of our simulations, we analyzed multiple subsets of 12 games each from a dataset generated from Olympic volleyball matches, focusing on teams that were competitive and close to each other in quality. We scored each match ourselves using the individual scoring system to provide us realistic outcomes to cross-reference against our simulations.
WIN POINTS
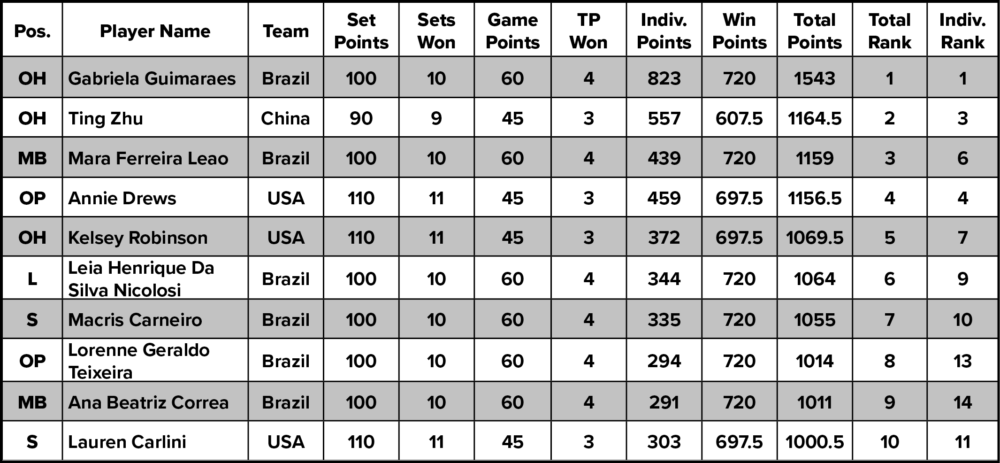
We could continue the exercise of scoring Olympic games to test the validity of our win point system as well. Because Athletes Unlimited matches are only three sets long, we cut off any matches which went to four or five sets and only used the first three sets for our analysis. We tried a number of different point distributions for set wins and match wins, from 15 for a set and 20 for the match, all the way up to 40 for a set and 50 for the match. Based on the outcomes of each of these simulations, we finally zeroed in on 40 for a set and 60 for the match, providing the perfect balance we wanted between individual points, win points, and MVP points. Below is an example of how players from Brazil, China, and the US would have scored in the Athletes Unlimited Volleyball league:
THE MVP VOTE
Finally, there’s the MVP vote to consider. This is an especially tricky aspect of the scoring system to track statistically because of its human element; statistics are unlikely to predict an MVP winner who earned votes through more intangible contributions like improving team morale or game-changing plays.
The best approximation of the MVP point system was to shift to a probabilistic model of distribution. One thing we had learned from MVP votes during the Athletes Unlimited Softball season was that, in general, the top nine individual point earners in a game were the most likely to secure an MVP spot. The higher the player was in the ranks, the better the odds. If we could assign a probability that a certain player would win MVP points, we might be able to evaluate how well the MVP points were weighted in the overall scoring system.
Returning to our individual point simulations, we could assign probabilities of earning MVP points to the top nine performers. The top performer would have a 30% chance of earning an MVP spot, the second best performer would have a 20% chance, the third best would have a 15% chance, all the way down to the ninth best performer with a 2% chance of winning the MVP vote. Then, the simulation could randomly award 60 points, 40 points, and 20 points to three of the top nine players based on their assigned probability. Repeating this version of the iteration 300 times gave us the statistical sample we needed to determine that these point values achieved the correct balance while maintaining some sort of realism over how MVP points are awarded.
CONCLUSION
Developing a scoring system often begins with theory, but it must always end with data analysis and statistical validation. However, performing simulations is more than just crunching numbers and sorting through data sets: a data analyst needs to balance the worlds of theory and reality to make the best decisions on what data sets to use, how to interpret those data sets, and how to translate real life outcomes into statistical tools. Human behavior in aggregate can yield interesting quantitative trends upon which assumptions can be made, but sports (and the scoring systems that guide them) are inherently built upon the capabilities and idiosyncrasies of humans that cannot simply be captured in numbers. In a sense, theory and reality inform each other: human ability informs what can and can’t be achieved, and theory quantifies those achievements so that humans can learn, improve, and set the bar even higher.
Have questions? Athletes Unlimited’s team of data analysts and volleyball experts will be answering questions from readers in early February. Send us your questions on Instagram and Twitter @AUProSports, and they may get included in our Q&A!