Athletes Unlimited Volleyball: Creating the final scoring system
Written by Chris McGown
One of the central features of the Athletes Unlimited experience is the unique way in which individual scoring is woven into the traditional scoring systems of the sport. In the process of developing an individual scoring system for volleyball, we faced several challenges that were endemic to high-level competition, especially around the specialization of positions. In volleyball, positional usage is very different. We see that setters, for example, tend to touch the ball in a rally, on average, twice as much as liberos and middles, creating unbalanced opportunities to score points between positions. How can we create a system that accurately measures the contribution of each individual while simultaneously affording the opportunity for low-usage positions to rank highly?
In Part 1 of our series, we looked at some of the statistical solutions pioneered by volleyball experts over the sport’s history — as well as some of our own potential solutions — in an attempt to overcome these challenges. While each exploration yielded some interesting insights into how individual statistics are tracked, none of them could rise up to the challenge of evaluating individual athletes equitably across positions. However, in consultation with Joe Trinsey, we were able to build on his previous work with USA Volleyball assigning value to each touch using Markov-Chain analysis. It appeared that a simplified and slightly modified version of this approach would suit our needs. Here’s Joe.
A RECAP
Written by Joe Trinsey
In our previous blog post, I described the process of calculating value for every volleyball action. When Athletes Unlimited asked me to consult on their new scoring system, my mind went to that Markov Chain analysis. The obvious challenge was to balance accuracy with simplicity: the scoring system needed to value each player’s contribution to winning or losing without becoming too convoluted to understand.
The simplest starting points were serving and serve-receiving actions. On average, professional-level women’s volleyball teams win the point about 60% of the time when they receive a serve and the serving team wins the point about 40% of the time. An ace moves the win probability for the serving team from 40% (0.4) to 100% (1.0), a +0.6 point change. On the flip side, a service error moves the win probability from 0.4 to 0.0, or a -0.4 change.
(Note: As a playing strategy, servers can choose to be more or less aggressive with their serves, at a potential cost of more errors. The above values suggest a game theory equilibrium of about three errors for every two aces, and that’s about what we see in FIVB Women’s Volleyball, suggesting that players, on average, intuitively find this balance.)
The value of passing actions are also simple to value. The receiving side always starts at about 0.6 win probability, so by getting aced (i.e. reception error), the passer has reduced the win probability from 0.6 to 0.0, for a value of -0.6. Likewise, passes that stay in play lend some value to the player’s team. The tricky part here is that passing evaluation requires subjective judgment.
ADDRESSING SUBJECTIVITY
Many actions in many sports require subjective judgment. In softball, the scorekeeper makes a judgment call between assigning a hit to the batter or an error to the fielder. A basketball scorekeeper judges whether a pass should be assigned as an assist or not. Likewise, volleyball statisticians assign various qualities of pass to a player.
Teams use a variety of methods to evaluate passing, and internal methods often vary from officially-kept stats. Many teams use a “3-point” or “4-point” passing scale to determine different qualities of pass. At USA Volleyball, we used six different quality markers, and also further differentiated them by location of the court. On the flip side, American NCAA box scores only list total receptions and reception errors (and some don’t even list total receptions).
To translate our research into a scoring system, I felt it was best to align most closely to official FIVB statistics and use three categories for reception: a “negative” (error), a “positive” (good/excellent pass), and a “neutral” play that falls into neither of those categories.
Analyzing the change in win probability then becomes simple: a reception error is a -0.6 change in value, the neutral reception doesn’t change positively or negatively, and the positive reception changes win probability from about 60% to about 70%, and is therefore worth 10%, or +0.1 points.
If determining the value of these simple actions seems complicated, the Markov Chain analysis I did for other skills got even more complex. In reality, there are many intermediate states between winning and losing. For example, after a perfect reception and a perfect set, the hitter approaches to spike with a win probability close to 0.8. But after a difficult play in which the defender is barely able to keep the ball alive, her teammates might be in a win probability environment below 0.5. A perfect analysis would take into account the difficulty of every situation and assign points accordingly. It would also be difficult for fans — and even players — to parse!
VALUING SKILLS
I mentioned that, on average, the receiving team (which is about to have “possession of the ball”, once the ball is served) has about a 60% chance to win the rally. It turns out that this 60% chance holds to be about true as the rally continues, over many rallies. Knowing this, we can assign values for hitters, blockers, and defenders. (Hold off on the setters for a moment!)
Let’s play out a scenario: If I’m a hitter, and my team has about a 60% probability to win the point whenever we are on offense, then my kills are worth about +0.4 (moving from 0.6 to 1.0) and my errors are worth about -0.6 (moving from 0.6 to 0.0). Getting dug, however, is worth about -0.2.
Likewise, if I’m a blocker or defender and I allow the hitter to kill the ball (either by a blocking or digging error), my errors are worth about -0.4 (moving from 0.4 win probability to 0.0). A blocker who records a stuff block has earned about +0.6 (moving from 0.4 to 1.0) and a digger who digs a ball has earned about +0.2 (moving from 0.4 to 0.6).
However, evaluating blocking and digging errors involves more subjective judgment than evaluating passing. Did that defender make an error by shanking, or mishitting, the dig, or was she hustling to cover a spot that a teammate vacated? What’s the difference between a blocker who gets tooled and a blocker who never gets in front of the hitter and allows her a free swing down into the court? You can see how gnarly evaluating these errors becomes, a less-than-ideal scenario for scorers and fans to agree on an outcome.
The other issue is that middle blockers and liberos also make a disproportionate amount of blocking or digging errors while also recording lower kill numbers, due to the function of their positions. This goes back to the core issue of establishing balanced scoring opportunities across sports, despite the types of skills they tend to execute. If we exclude blocking and digging errors, it could make the league more balanced between positions.
Finally, we have to value setting. Valuation for setting is difficult and is the most subjective of all skills. In order to limit subjectivity, we used two categories to evaluate setters: setting errors (by extension of our existing framework, worth -0.6 points) and assists. Since an assist necessarily depends on the next action of the hitter, the valuation was based less on change in win probability, and more on assigning a point value that would give the setters a competitive chance in the league, without giving them an overwhelming advantage.
So in summary, we end up with these overall trends:
- Defensive plays (Aces, Blocks) that win the point are worth +0.6 points.
- Offensive plays (Kills) that win the point are worth +0.4 points.
- Defensive plays that lose the point (Serve Error) are worth -0.4 points, but other errors (Block Errors, Dig Errors) are biased against certain positions and thus removed.
- Offensive plays that lose the point (Pass Error, Set Error, Hitting Error) are worth -0.6 points.
- Non-scoring plays (Good Receptions, Digs) are judged to be worth +0.1 and +0.2 points respectively.
Once we had these valuations, we could use them to create a final point system that would be accurate, simple, and fair. Not an easy task! Back to Chris.
FINAL POINT SYSTEM
Written by Chris McGown
Thanks, Joe. To come up with our final individual point system, we made three significant yet minor updates to the true-value scores that Joe had calculated:
- We eliminated the penalties for Block Errors and Dig Errors.
- We lowered the value of an Assist from .1 to .05
- We raised the value of a Dig from .2 to .25
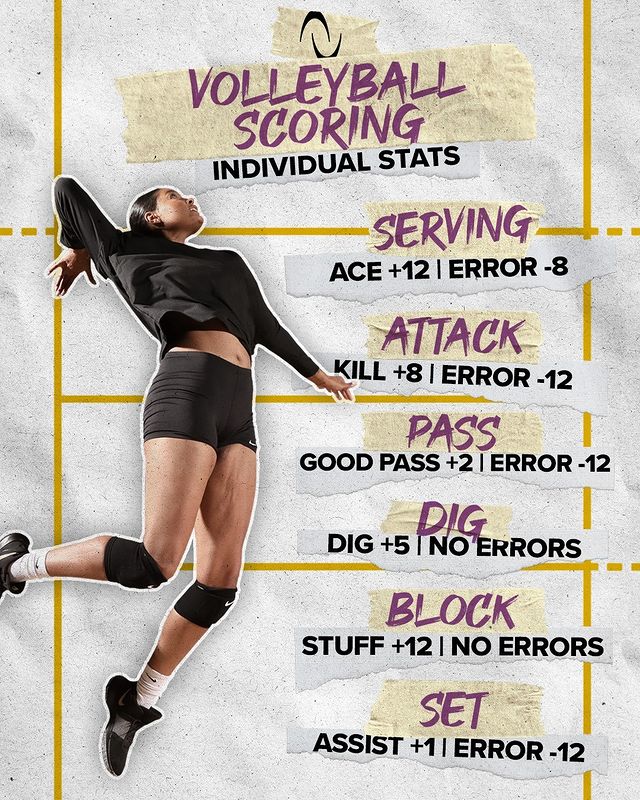
In order to make points more easily calculable for fans and athletes, we first moved the decimal point over (+.6 became +6) and then doubled all scores to eliminate the fractions on Digs and Assists (+2.5 became 5, and .5 became 1). The result: the individual scoring system Athletes Unlimited will employ.
- Serve Ace + 12, Serve Error -8
- Attack Kill, +8, Attack Error -12
- Positive Reception, +2, Reception Error -12
- Assist +1, Setting Error -12
- Dig +5
- Block +12
CONCLUSION
The impact of an individual player on the outcome of the match has long been something that volleyball coaches and statisticians have been searching to quantify. While there are several good methods that vary in complexity and data volume requirements, they all seemed to have significant limitations with respect to the needs presented by the Athletes Unlimited system:
- To evaluate player performance accurately.
- To afford opportunities for every position to rank highly on the leaderboard.
- To separate individual performance from team results.
- To accommodate for short seasons and limited data sets.
In considering these objectives, it was clear that none of the existing methods for player evaluation would work well on their own, but that the solution may be found in modifying previous statistical work. Joe’s Markov-Chain analysis was incredibly valuable in providing the foundation for the scoring system we know today, and with some modifications we were able to strike a balance that provides all 44 athletes the ability to rise to the top while still observing statistical accuracy.
Have questions? Athletes Unlimited’s team of data analysts and volleyball experts will be answering questions from readers in early February. Send us your questions on Instagram and Twitter @AUProSports, and they may get included in our Q&A!