HOW ATHLETES UNLIMITED REWARDS EVEN THE LOSING TEAM FOR EFFORT AND MAKES EVERY PLAY COUNT
If you’ve ever gone to a youth sporting event, you’ve probably spotted at least one parent who is way too invested in the game. They shout with the lungs of an opera singer, blabber incessantly about how naturally gifted their child is, and are always one “bad” call away from socking the umpire in the face (“Get your eyes checked, blue; my son clearly threw a strike!”). To them, their team’s loss is akin to dishonor on the family name, deserving of a play-by-play analysis at the dinner table. Their kid’s good plays or the team’s well-executed maneuvers can get lost in the turmoil of disappointment.
Even in professional sports, fans can get riled up when their favorite player is wronged by a bad call or an unfortunate play. Remember how former Detroit Tigers pitcher Armando Galarraga was robbed of his perfect game against Cleveland because umpire Jim Joyce made a mistake? Even though he and Joyce reconciled, fans were furious that the Tigers were robbed of their first perfect game in the team’s 110-year history.
So much is left unsaid when you look at the final score of a game. All of the events that transpired – the awe-inspiring plays all the way to the second-hand embarrassments – only add up to one thing: a win or a loss. If your team won (and your favorite player helped out), that’s great for you. But if your team lost, you have nothing to show for it after all that effort.
The overzealous parent in all of us could catch a break if there was a way to reward our favorite players and teams for doing well, even if they ultimately lose. What if there was a league whose scoring system made every play count?
Athletes Unlimited
Many sports, including softball, are split up into periods that encapsulate a series of events. This helps determine some of the rules around how to play the game, as well as split it up into manageable chunks for everyone watching. Athletes Unlimited proposes awarding teams points for how well they do in innings, not just how well they do in the overall game.
Put another way, rather than looking at a softball game as one large event with seven parts, we can look at a softball game as seven smaller events with a bigger prize at the end. If players have the chance to earn points each inning, the tendency to give up when faced with an insurmountable lead should hopefully diminish. That means getting to watch players who play harder for more opportunities at a piece of the pie. Better get a refill on your drink – things are about to get interesting.
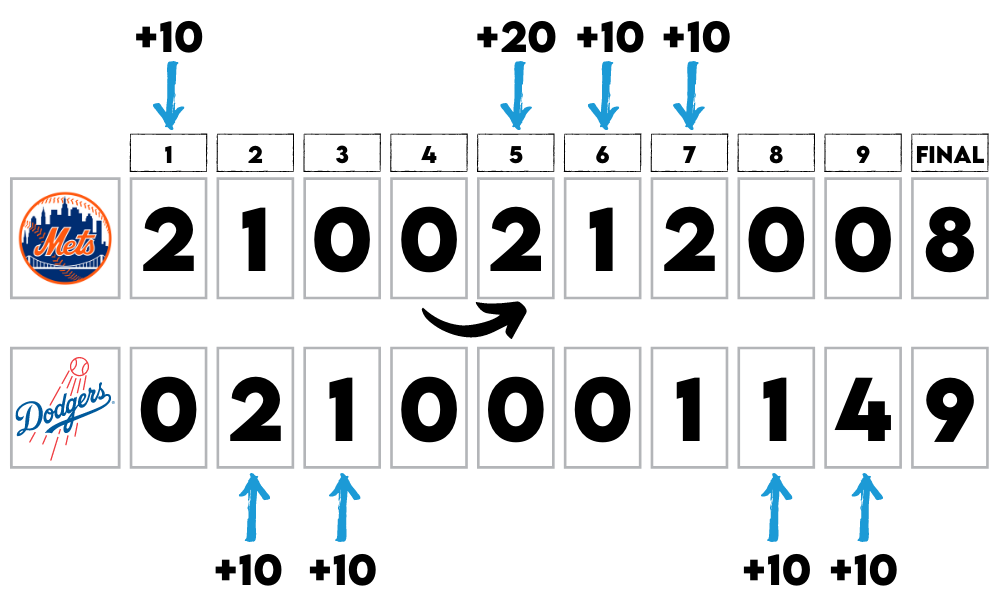
My colleague, Phillip Maymin, does a great job of breaking down the Athletes Unlimited scoring system in terms of innings in his blog post, if you want to see how the points would work in action. For the purpose of this discussion, all you need to know is that teams can earn 10 points for each inning they win, with 50 points being awarded to the winner of the game. If the inning ends in a tie, the points carry over until one team wins an inning.
Here is an example of that:
Analysis
The critical question to ask is whether or not this system is fair to all of the players. We can examine this empirically by applying the scoring system to historical game data and compare how teams do in the Athletes Unlimited scoring system versus how well they did according to our normal understanding of wins and losses. Let’s return to Major League Baseball, which is similar to softball and has lots of historical game data that is available to the public.
For this analysis, we decided to look at two sets of four teams (since there will be four teams in the Athletes Unlimited softball league) from the MLB 2019 season. The first is a set of four teams that ranked somewhere in the middle: the Arizona Diamondbacks, the Chicago Cubs, the Boston Red Sox, and the New York Mets; which ranked between 12 and 15 in the league during the entire season. Then, to see if anything is different, we’ll also look at the top four teams: the LA Dodgers, the Houston Astros, the Minnesota Twins, and the New York Yankees. If the difference in win potential between teams gets smaller, it means the teams are more evenly matched and have a better chance of walking away with something that contributes positively to their league ranking.
Methodology
There are two metrics we can use to understand how parity is impacted when we apply the Athletes Unlimited scoring system: win percentage ranges and standard deviations. Let’s review each one:
- Win Percentage Ranges – A way to measure how closely matched two teams are is to compare their win percentages: how many of the games they won over the games being observed. The win percentage of the highest ranking team minus the win percentage of the lowest ranking team represents the range of competitiveness. The smaller the range, the more closely matched the teams are.
- Standard Deviation – Standard deviation is defined as the variation of a set of values from the average. If the average number of runs scored by a softball team was five with a standard deviation of two, this means that a team who scored seven runs achieved a score that is one standard deviation away from the average, or more unusual than expected. A team that scores nine runs is two standard deviations away from the average, which is even more unusual. Small standard deviations suggest that teams perform closer to average and are thus more evenly matched.
Because the Athletes Unlimited softball league will host a 15-game season for each team (30 games total), we decided to look at these metrics in 15-game chunks. We also wanted to avoid any unusual strategies that MLB teams tend to adopt at different points in the season, since MLB teams have large rosters and evolving priorities over 162 games, while Athletes Unlimited softball players get drafted onto a new team each week. As a result, we scrapped the beginning and end of the MLB season and focused our efforts on games 30 to 105, analyzing each 15-game set in that range.
So, what did we find?
Results
Top Teams
One assumption we can reasonably make is that the top four teams of any league are relatively closely matched. In order to make it to the top, teams have to compete at the highest level, and they have to do it consistently. Even a typical win/loss system can recognize high parity between its top-performing teams.
When we look at our first metric, win percentage range, we see a slight difference between the Athletes Unlimited scoring system (12.2%) and the typical win/loss system (13.4%). This demonstrates that the Athletes Unlimited method of scoring by inning makes the top 4 teams more evenly matched, albeit only slightly.
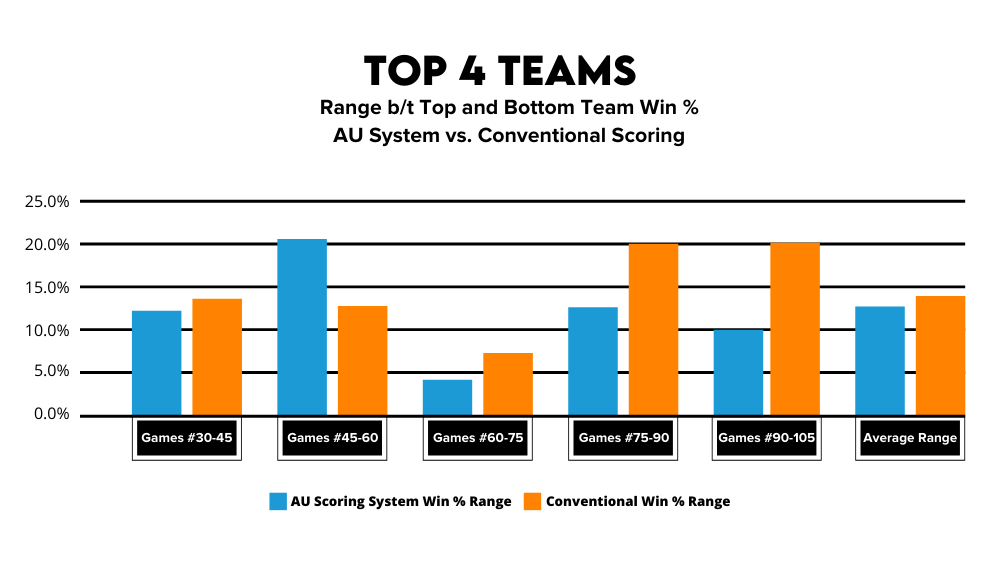
We then calculated the average standard deviation between each team’s win percentage, finding that the Athletes Unlimited model’s standard deviation is 5.7% versus the MLB’s 4.7%. This actually suggests that the top four teams, according to the Athletes Unlimited scoring system, are slightly less evenly matched than in the standard win/loss system. However, because it’s only a difference of 1%, we can reasonably conclude that the standard deviations between the two systems are similar and that the teams remain closely matched. The MLB 2019 season had four exceptionally close matched teams at the top. A close range and similarly small standard deviation implies that both scoring systems are maintaining parity among the top teams. But what about teams lower in the league rankings?
Middle Teams
As you go further down the leaderboard, the consistency and competitiveness of play tends to get more unpredictable. This is a more accurate reflection of a pool of players coming from different backgrounds with different levels of experience. What we hope to find is that, by scoring points every inning, these teams become more closely matched.
Sure enough, the numbers look more noticeably improved. The average win percentage range for these MLB teams is 20.4%, but when we applied the Athletes Unlimited scoring model, that number drops to 14.4%. This is a significant improvement in parity between the middle four teams, likely because the Athletes Unlimited scoring system still rewards good performance from inning to inning, even if a team ultimately can’t see it through to a win.
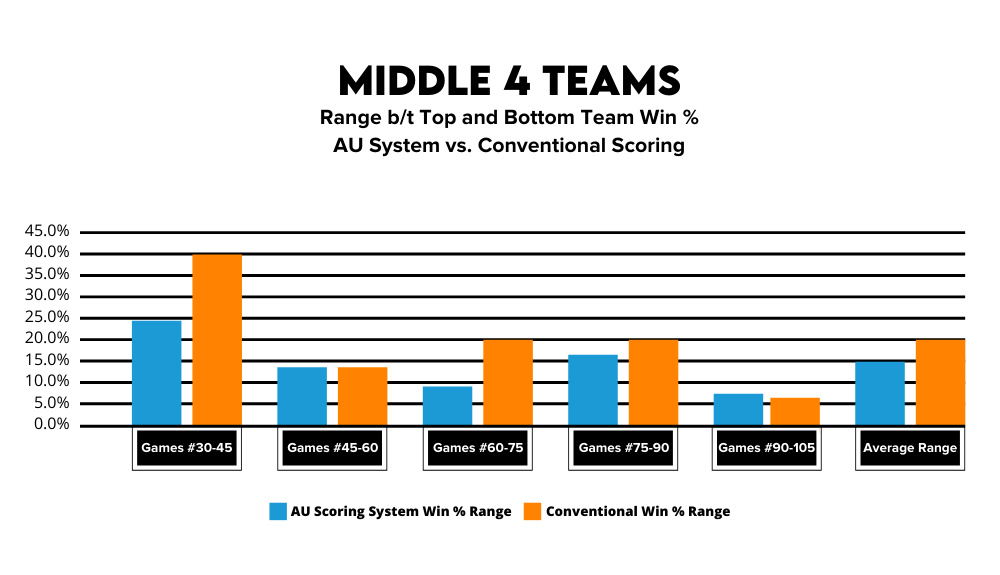
The average standard deviation also improves, down from 11.17% (MLB) to 6.27% (AU). This suggests that there is more unpredictability in who will win because the teams are more closely matched, which makes for higher stakes and more competitive play. Overall, our analysis shows that scoring by inning, rather than just scoring the whole game, makes the experience fairer for everyone. Top teams and players still maintain an unrivaled amount of parity, but the middle of the pack has more opportunities to demonstrate their athletic prowess and walk away with something to show for it.
Conclusion
The fate of the overzealous parent or the die-hard franchise nut is not sealed in misery. Based on our analysis, we saw that the new Athletes Unlimited system brings about much greater team parity than the conventional win/loss scoring system. Fans will love it more for the closer games and greater excitement it brings. Players will love it for being rewarded for smaller wins within games and getting some consolation points even if they lose a heartbreaker. Teams will never feel as if they are out of the running, as the system ensures that, barring complete dominance, the teams will be closely matched in terms of points. The system also bodes well for player morale. It rewards athletes on losing teams who often go on hot streaks and make amazing plays which go under the radar when their team loses.
The success of a professional sports league is entirely dependent on the team parity in the league, and results show that Athletes Unlimited’s new system seems to be the way forward to more balanced and competitive leagues in the sporting world.

