
PARITY UNLIMITED?
How Athletes Unlimited allows for more equality amongst teams
Parity, or equality, plays a pivotal role in all professional team sports.
On the one hand, fans tend to dislike perfectly predictable outcomes where the underdog doesn’t really have a shot. The Harlem Globetrotters and their 20,000-3 record against the Washington Generals are the exception that proves the rule: such dominance is more comedy and entertainment than sport.
On the other hand, fans tend to dislike pure coin tosses too. Better teams should have some higher chance of winning, but not too much. It’s a delicate, pivotal role for team parity.
The best competition needs some amount of parity, but not too much. It’s the Goldilocks problem of sports. How can the best teams win while still giving the worst teams a reasonable shot?

Athletes Unlimited
If you’re launching a new professional sports league without any historical baggage, you have the opportunity to develop a scoring system that finds this delicate balance. How should you set up your scoring system to keep team parity in that just-right Goldilocks region?
While the entire Athletes Unlimited scoring system for individuals has additional components, the component based on team performance is pretty straightforward.
Rather than merely earning one point for a win and nothing for a loss, team points in the Athletes Unlimited softball system are awarded on a per-inning basis: if your team wins an inning, you get 10 points, and if your team wins the whole game, you get an additional 50 points. That way, since you must win at least one inning to win the game, and there are seven innings per game, the winner always gets at least as many points as the loser.
What about overtime or tied innings? Overtime is considered just an extension of the seventh inning and doesn’t generate additional points. But the points that would have been earned from a tied inning roll over into the next one.
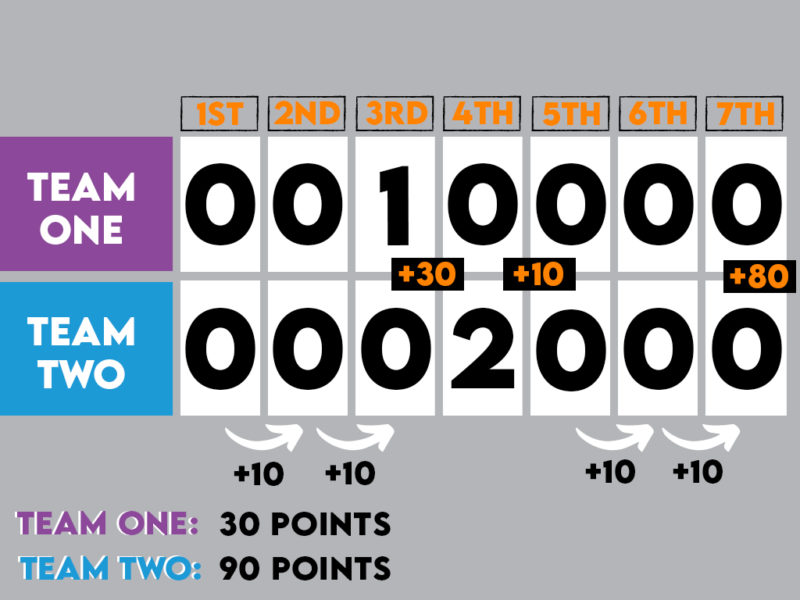
So suppose your first three innings go: 0-0, 0-0, 1-0. So far you would have earned 30 points and your opponent zero.
In the fourth inning the opposing team takes the lead, scoring two runs. Now you have 30 points and they have 10 points.
Then the last three regular innings are scoreless: 0-0, 0-0, 0-0. You still have 30 points, all from the first three innings, and the opponent still has just 10 points, from their strong showing in the fourth inning.
But the game is over, and, sorry to say, you lost 2-1. So the opponent gets an extra 50 points for winning the game. What about those last three innings? Shouldn’t there have been another 30 points to go around?
Indeed — and they go to the winner, because they effectively rolled-over until the game ended.
So the final team points are: 30 points for your team, and 90 points for the other team: 10 points from the fourth inning, 50 points from winning the game, and 10 points from each of the last three scoreless innings.
Simulations
For a league with a long history, it is easy to examine historical data and make conclusions about parity. But how can we evaluate the parity of a league that doesn’t exist yet?
There are two ways: theoretical and empirical. That is to say, we can try to do simulations and see what would happen in a hypothetical world (theoretical), and we can look at the data of other leagues and try to see what would have happened if they had used our scoring system (empirical). There are pros and cons to each approach, so it’s worthwhile to do both.
In this post, we’re going to look at simulations, or the theoretical. The technical details are available in this white paper, but here is the basic idea.
Let’s suppose that our four Athletes Unlimited teams are reasonably unequal in terms of talent. Team A is the strongest on paper, and their offense is expected to score on average about five runs per game against an average defensive team. Team B is next, and they are expected to score four runs per game. Team C gets three and Team D gets two.
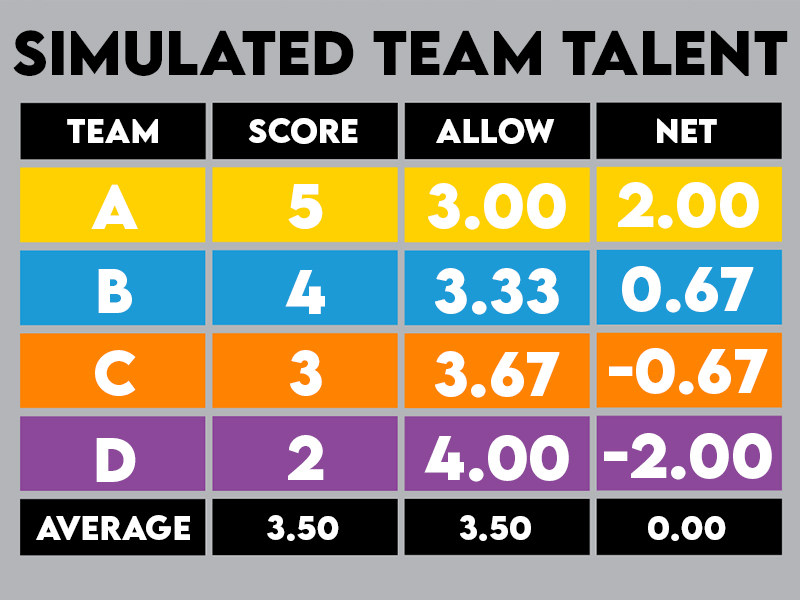
The first thing we need to figure out is what that implies for their defense. The average team scores 3.5 runs per game. But Team A’s opponents are only Teams B, C, and D, and those three teams average only 3.0 runs per game [(4 + 3 + 2) / 3 = 3.0], or half a run per game below the average. That means Team A’s defense is above average, since they allow fewer runs than the average team. Team A is a great team!
We can go through the same process for the rest of the teams to get both offensive and defensive numbers for each. Then, we could conclude Team A is awesome and Team D is terrible.
But wait! We’re aiming for a simulation that represents a real-life scenario. Just because we know how teams will perform on average doesn’t mean they will either score or allow exactly the same number of runs every inning. So, we will essentially toss coins to simulate possible innings. Those simulated innings can stack into entire simulated games, and these simulated games can stack into weeks of six simulated matchups (A vs B, A vs C, A vs D, B vs C, B vs D, and C vs D).
Results
So what do we get? Let’s evaluate our simulations in two ways. First, how equal or unequal would things look if we just used the conventional win/loss scoring system where the winning team earns one point and the losing team earns nothing? Next, how would things look under the Athletes Unlimited system?
There are different ways to measure inequality, but one of the most commonly used ones is called the Gini coefficient. The Gini coefficient measures the concentration of wealth in a society. It ranges on a scale from zero, meaning everybody has an equal amount of wealth, to one, meaning exactly one person holds all the wealth and everybody else is broke.
It’s used for measuring income and wealth inequality both within and across nations, but it’s also commonly used to assess team parity. Does one team hoard all the wins or points? Or are they more evenly spread out across all the teams?
We simulated the outcome of each of the six games in a week. For each simulation, we have specific outcomes; for example, Team A beat Team B 5-2, Team A beat Team C 5-4, and so on. We can count the number of points that each team got in that simulation in each of the two ways. According to the conventional win/loss system, Team A would have gotten one point for each of those two games, while Teams B and C would have gotten nothing.
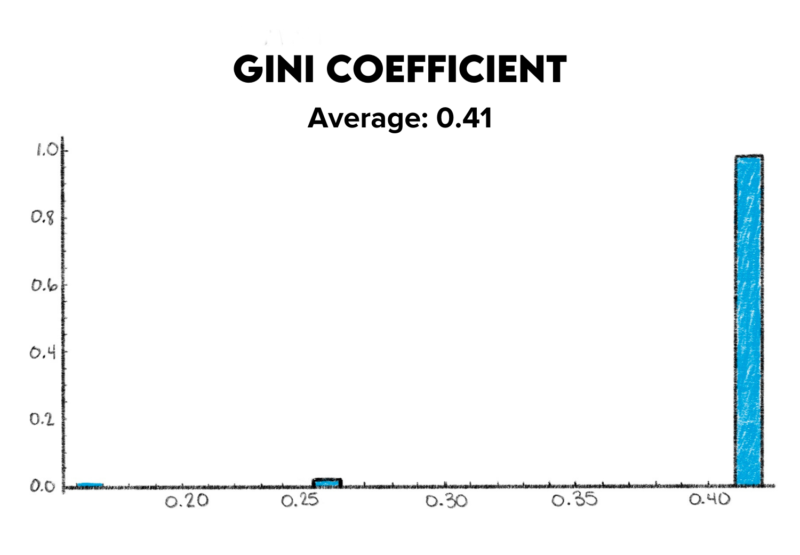
Adding up all the games, we can see how many points, or wins, each team has, and what the concentration looks like. Then, we do that 1,000 times, to get a sense of how much that concentration changes across different random simulations, and what the average is.
The average is about 0.41, so a little closer to pure equality than pure inequality. You can also see in the histogram below that the Gini coefficient is almost always just one number, and overall it just fluctuates between three possible outcomes. There is not much variability across the simulations.
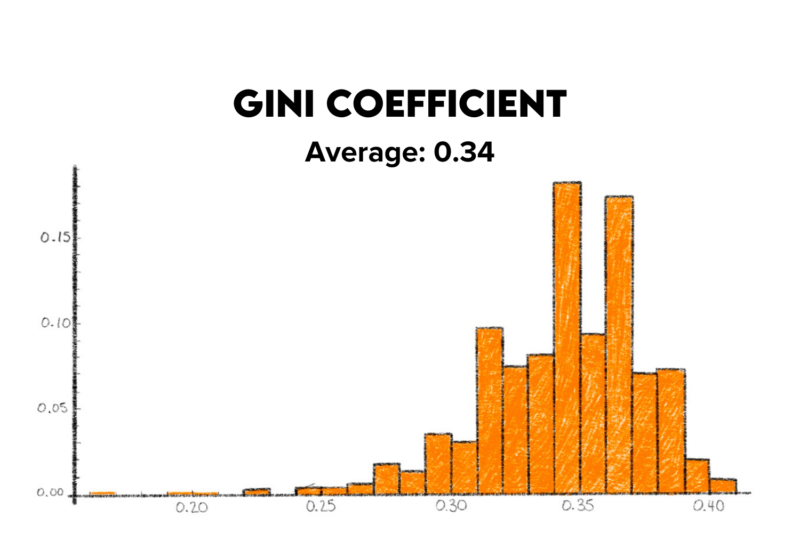
What about if we score the outcomes based on the Athletes Unlimited system? Instead of awarding just one point to game winners and none to game losers, let’s see what would happen if we give 10 points per winning inning and 50 points per winning game.
The average drops a lot, to about 0.30, meaning the Athletes Unlimited scoring system ensures more team parity. You can also see in the histogram below that there is much more variability across the simulations. It ranges from below 0.20 to above 0.40 and can be anywhere in between.
Conclusion
So, what have we learned here? After running thousands of simulations, we saw that the new Athletes Unlimited system demonstrates much greater team parity than the conventional win/loss scoring system. In other words, the Athletes Unlimited scoring system is friendlier and more exciting to players and fans because it levels the playing field. There’s no way to be bored when there’s always the chance for the underdog to take down the reigning champion.
If you think about it, the result isn’t all that surprising. Think about fist bumps, or handshakes, or high fives. If you only congratulated people after they won a game, then over time, most of your congratulations would go to just a few athletes. But if you give a thumbs up for every good play, your congrats would be far more evenly distributed. Players on both the winning team and the losing team are capable of great plays (and are deserving of your praise), but at the end of the day, the winning team inherently delivers more great plays.

